
Here’s a series of articles which will help you understand the importance of Systematic Investment Plan (SIP) and its countless benefits. We do hope these articles will convince you that ‘SIP Sahi Hai!’.
Investor academy
Welcome to the
Investor Academy
Choose from a range of educational infographics and blogs to help you take a calculated investment decision


Benefits of large caps
Different types of investment returns
Midcap funds demystified
Happy Financial Independence Day!

An investment that can help you beat inflation
Plan for your child’s future with SIPs
What should an investor do in a volatile market?
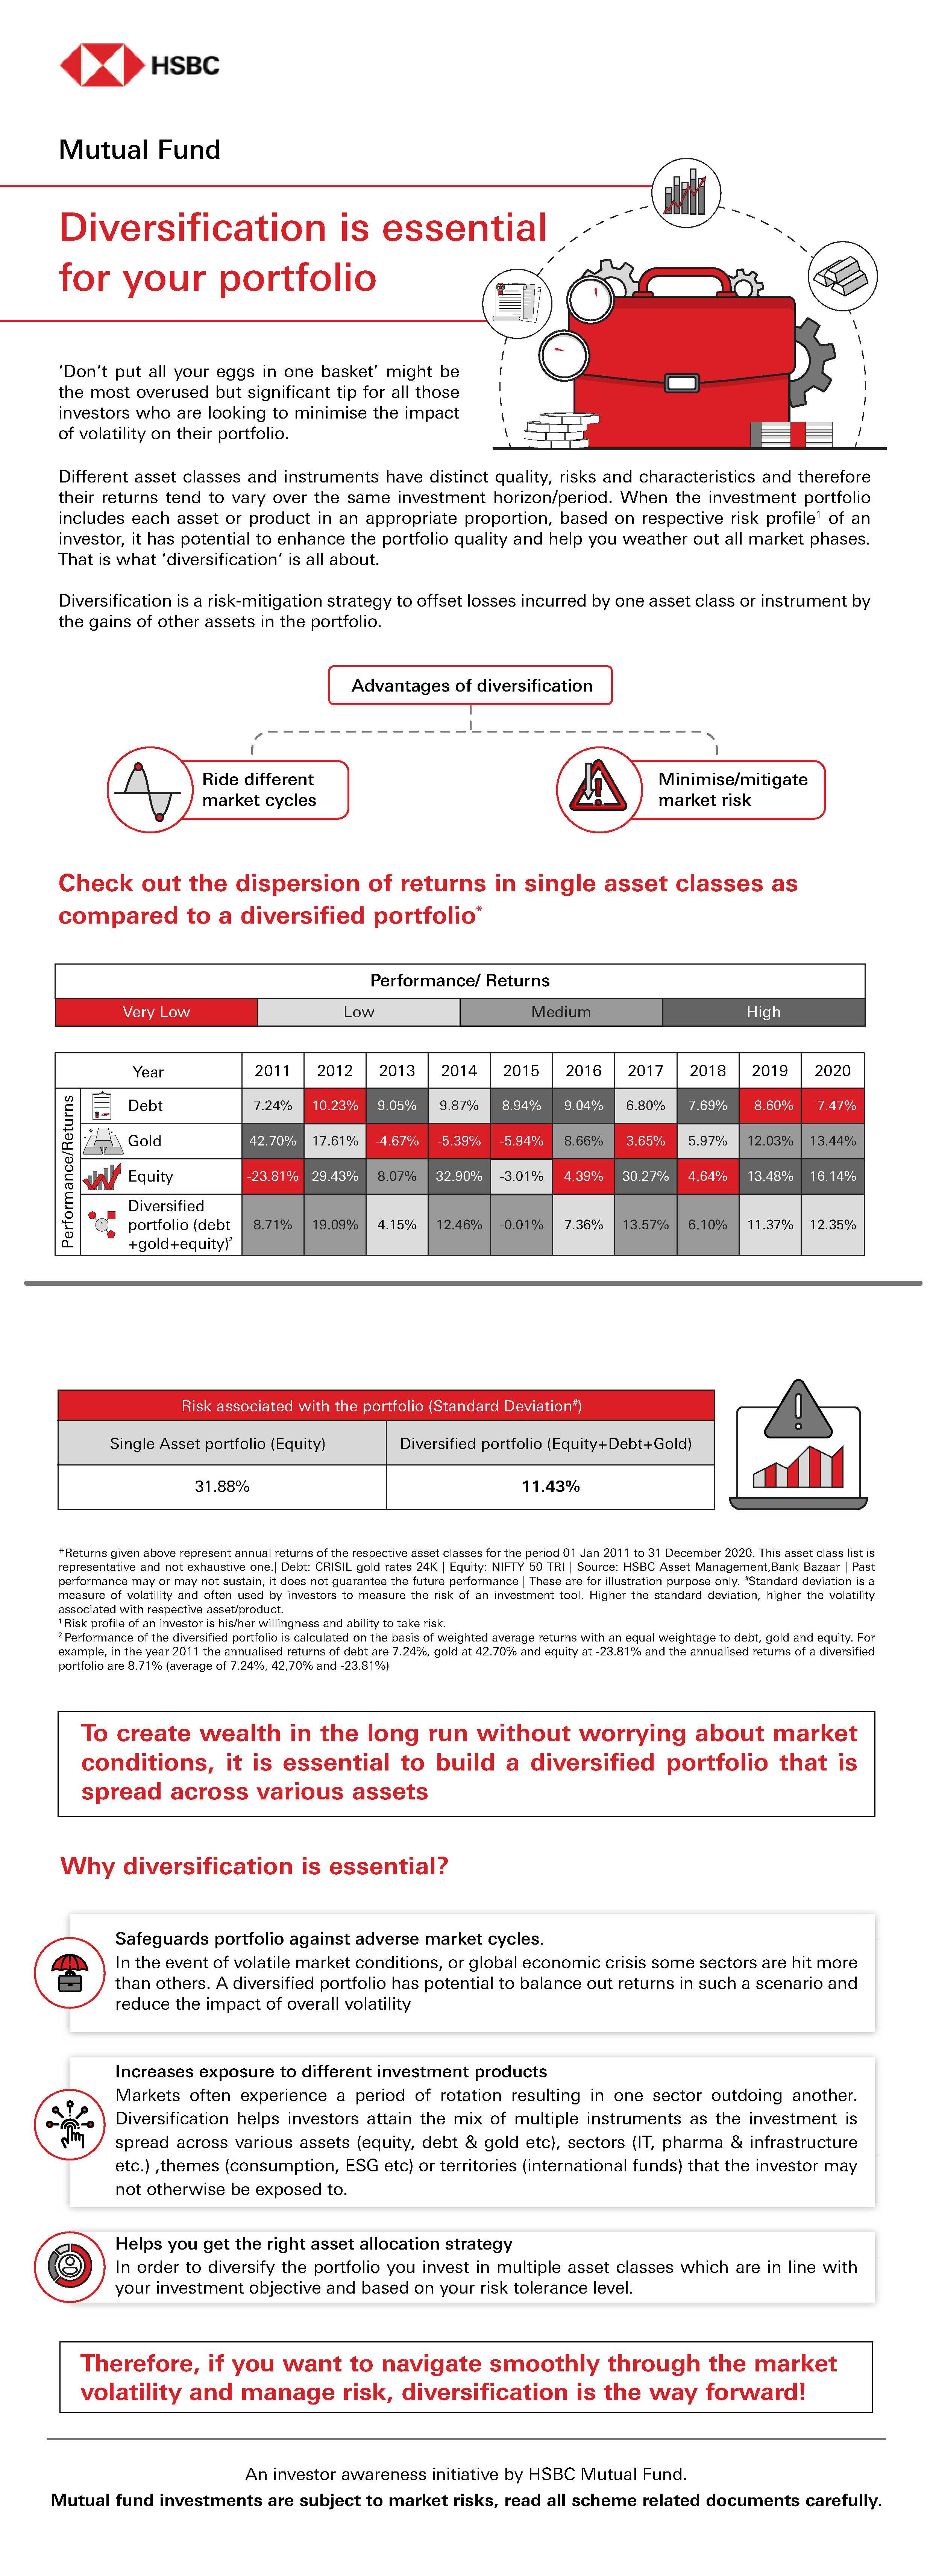
Diversification is essential for your portfolio
Why tax planning with mutual fund ELSS is a good option?
Section 80C of Income Tax Act of 1961 allows investors to claim deduction of up to Rs 150,000 from their taxable incomes by investing in certain schemes which are eligible u/s 80C. These schemes include Employee and Voluntary Provident Fund (EPF and VPF), Public Provident Fund (PPF), National Savings Certificates (NSC), 5 year tax saver bank fixed deposits, life insurance policies (both traditional and unit linked) and mutual fund Equity Linked Savings Schemes (ELSS).
How to plan your taxes?
There are various sections in Income Tax Act, which can enable investors to claim tax deductions but we will restrict ourselves only to section 80C in this post.
- The maximum allowable deduction irrespective of income tax slabs u/s 80C is Rs 150,000
- If you are a salaried investor and contributing to EPF, your contribution to EPF will be included in 80C deduction
- If you are paying home loan EMIs, then the principal component of the EMI payments for the year will also be included
- If you have life insurance policies, the premium for the year will be included
- Calculate how much deductions you can claim from the above and how much investment you need in order to claim the full benefit u/s 80C
- Select the suitable 80C scheme to make your tax saving investments depending on your risk appetite and financial goals. In this post, we will discuss how mutual fund ELSS can you help you in tax planning and also wealth creation over long investment tenures
What is ELSS?
Equity linked savings schemes (ELSS) are equity mutual fund schemes. Investments in ELSS are eligible for deductions from your taxable income under Section 80C of Income Tax Act. There is no upper limit on investments in ELSS, but maximum deduction allowed u/s 80C is capped at Rs 150,000. ELSS funds have a lock-in period of 3 years. No redemption or withdrawal is allowed in the lock-in period. If you are investing in ELSS through Systematic Investment Plan (SIP), each SIP instalment will be locked in for 3 years.
ELSS invests in equity and equity related instruments. ELSS funds usually diversify across market cap segments and industry sectors; there are no SEBI mandated limits on market cap allocations for ELSS. Since ELSS funds are market linked investments, they are subject to market risks. You should invest according to your risk appetite and consult with your financial advisor if you need any help.
Why invest in ELSS?
- Interest rates of Government small savings schemes eligible for 80C deductions e.g. PPF, NSC etc are steadily coming down over the last several years. Interest rate of PPF and NSC as on 31st December 2021 are 7.1 per cent and 6.8 per cent respectively (source: GOI, Department of Post). 5 year tax saver Bank FD rates have also come down.
Equity as an asset class, though volatile, has historically given superior returns over long investment horizons. The chart below shows the CAGR (annualized) returns of Nifty 50 TRI over different investment tenures ending 31st January 2022.
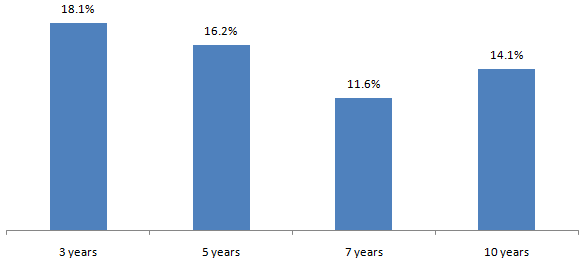
Source: National Stock Exchange, Advisorkhoj Research, as on 31st January 2022. All returns are in CAGR.
Disclaimer: Past performance may or may not sustained in the future
Tax planning should not be just about tax savings; it should also help you in your long term financial goals. ELSS investments have the potential to create wealth over long investment tenures.
The chart below shows the growth of Rs 10,000 monthly investments in Nifty 50 TRI. With a cumulative investment of just Rs 12 lakhs in 10 years, you could have accumulated a corpus of more than Rs 26 lakhs. Please note that we have taken Nifty 50 TRI as a proxy for equity as an asset class. Since ELSS invests across equity market cap segments, there is potential of higher alphas and wealth creation.
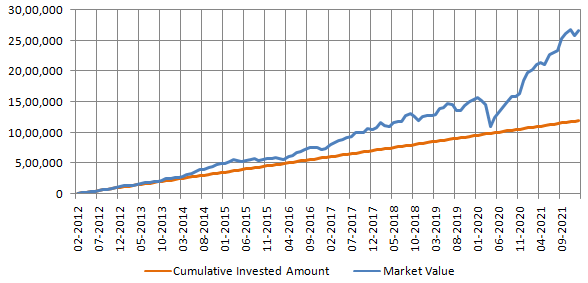
Source: National Stock Exchange, Advisorkhoj Research, as on 31st January 2022. All returns are in CAGR.
Disclaimer: Past performance may or may not sustained in the future
ELSS provides superior liquidity compared to other 80C investment options. ELSS has lock-in period of just 3 years. Other 80C investments do not provide any liquidity before minimum 5 years. Liquidity is always an important consideration in investments. - ELSS is one of the most tax efficient investment options u/s 80C. Capital gains of up to Rs 100,000 are tax exempt and taxed at 10 per cent (plus applicable surcharge and cess) thereafter. However, if you opt for the IDCW option, then the dividend payments will be added to your income and taxed as per your income tax slab.
Who should invest in ELSS?
- Investors who are looking for tax savings and capital appreciation over long investment tenures. Investors with moderately high to high risk appetites. Consult with your financial advisor, if you are unsure about your risk appetite
- Investors with minimum 3 years (lock-in period) investment tenure. However, we recommend 5 years plus investment tenures for ELSS
Investors should consult with their financial advisors if ELSS is suitable for their tax planning needs and invest as soon as possible in order to claim tax benefits in this financial year.
Should you invest in Flexicap mutual Funds?
What are market capitalization segments?
Market capitalization typically tells us how much a company is worth. Market capitalization of a stock is the market price of the stock multiplied by the number of total outstanding shares. Stocks can be classified into different segments based on their market capitalization. According to SEBI, there are three market capitalization segments – large cap (top 100 stocks by market capitalization), midcap (101st to 250th stocks by market capitalization) and small cap (251st and smaller stocks market capitalization). Stocks in different market capitalizations segments have different risk profiles. Equity mutual funds are also categorized on the basis of the market cap segments they primarily invest in e.g. large cap, midcap, small cap fund etc.
What are Flexicap Funds?
Flexicap funds are diversified equity mutual fund schemes which can invest across market cap segments. There are no upper or lower limits with respect to allocations to any market cap segment. The fund managers of these schemes can invest any percentage of their assets in any market cap segment viz. large cap, midcap and small cap according to their market outlook.
Flexicap mutual funds category is one of the most popular equity mutual fund categories in India.
Difference between Flexicap and Multicap Funds
The term Flexicap Funds is relatively new. Equity schemes with flexible market cap mandates were previously known as Multicap Funds. In November 2020, SEBI introduced market segment wise limits for Multicap Funds to make them true to label. At the same time, SEBI introduced a new equity fund category called Flexicap Funds. Multicap Funds must invest at least 25 per cent of their assets in large cap stocks, minimum 25 per cent in midcap and minimum 25 per cent in small cap stocks. Multicap Funds will have minimum 50 per cent allocation to midcap and small caps.
Flexicap Funds, on the other hand, have no market cap limits, and therefore, it can have any percentage allocation to any market cap segment. It is important for you to understand clearly, the difference between these two fund categories and make informed investment decisions.
Why invest in Flexicap Funds?
- Winners rotate across market cap segments: One market cap segment cannot keep outperforming or underperforming across all market conditions or investment cycles. Historical data shows that winners rotate across different market cap segments – see the chart below. Flexicap fund managers can generate risk adjusted returns by rotating allocations to different market cap segments based on their outlook.
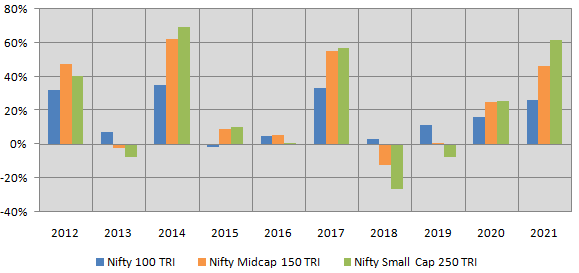
Source: National Stock Exchange, Advisorkhoj Research (as on 31st December 2021). Nifty 100 TRI represents large cap, Nifty Midcap 150 TRI represents midcap and Nifty Small Cap 250 TRI represents small cap stocks. Disclaimer: Past performance may or may be sustained in the future. - Manage downside risks: The table below shows the 5 biggest drawdowns in the market in the last 10 years or so and the impact on various market capitalization segments. You can see that large caps are considerably less volatile than midcap and small cap stocks. The manager of a Flexicap Fund can prudently manage risks by shifting allocations between market cap segments based on their outlook.
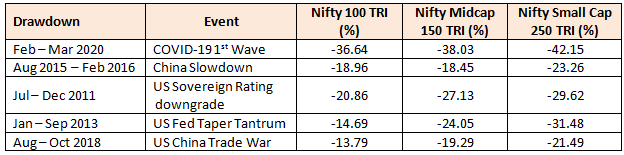
Source: National Stock Exchange, Advisorkhoj Research (as on 31st December 2021). Nifty 100 TRI represents large cap, Nifty Midcap 150 TRI represents midcap and Nifty Small Cap 250 TRI represents small cap stocks. Disclaimer: Past performance may or may be sustained in the future.
Potential of generating alphas: Large cap stocks have high percentage of institutional ownership, are more researched and therefore, have better price discovery. Opportunities of alpha creationarehigher in midcaps and small caps, which are less researched compared to large cap stocks. The universe of midcap and small cap stocks is also much larger than large cap stocks. Flexicap fund managers may be able to find quality mid and small cap stocks at attractive valuations, thereby creating alphas for investors over long investment horizons -
Higher liquidity than small / midcap funds: Since midcap and small cap companies usually have high percentage of promoter ownership, the percentage of free floating shares in these companies is much lesser than large caps. In extreme market conditions, liquidity may be an issue with midcap and small cap stocks. Large cap stocks, on the other hand, are traded in large volumes. The large cap allocation may support flexicap funds ensures reasonable liquidity to meet redemption pressures in difficult market condition.
Ideal for investors: Diversification across different market cap segments can reduce unsystematic risks and generate risk adjusted returns. Flexicap Funds are ideal for investors who are not able to decide how much allocations they should have towards each market cap segments and want the fund managers to decide on market cap allocations
Who should invest in Flexicap Funds?
- Investors who want capital appreciation over long investment horizon
- Investors with high to very high risk appetites
- Investors who have at least 5 years plus investment tenures
- You can invest in these funds either in lump sum or SIP depending on your financial situation and investment needs
Investors should consult with their financial advisors if Flexicap Funds are suitable for their investment needs.
How Large Cap Mutual Funds provide stability to your portfolio
What are large cap funds?
In India, companies listed on the stock exchanges between 1 – 100th in terms of full market capitalization are called Large Cap companies (Large Cap stocks). Large cap funds are equity mutual fund schemes which have to invest at least 80 per cent of their assets in large cap stocks.
Characteristics of large cap stocks
- Large cap companies are typically large in size in terms of sales. Generally, they are amongst the biggest companies in India and are household names
- Large cap companies have proven history and stable business models. The average age of companies which form part of the Sensex (30 largest companies by market capitalization) ranged between 48 to 56 years over the last 20 years i.e. on average most of these companies have been in existence for nearly 50 years (source: Value Research)
- Normally Large cap companies are leaders in their respective industry / sectors in terms of market share. As such these companies are usually better positioned to survive economic downturns
- The core sectors of the Indian economy like coal, oil and gas, petroleum products, steel, cement, power etc. are dominated by large cap companies. Many of these sectors are highly capital intensive and significant barriers to entry. As such, large cap companies dominating these sectors enjoy the advantage of deep competitive moats
- Large caps usually have large percentage of Institutional (FIIs and DIIs) ownership compared to midcaps and small caps. Large caps are well researched and provide better visibility of earnings compared to midcaps and small caps
- Generally, large caps have large percentage of institutional ownership, they are traded in large volumes in the stock market and are highly liquid. Midcaps and small caps, on the other hand, typically have large percentage of promoter ownership. Since midcaps and small caps have smaller percentage of free-floating shares, they trade on thinner volumes compared to large caps and are hence, relatively less liquid compared to large caps
- Large caps have relatively lesser risk in downturns (owing to their market share leadership) and provide more earnings visibility compared to midcaps and small caps, they usually may command higher valuations compared to midcaps and small caps
Large cap versus mid / small cap funds
- As per SEBI’s mandate, large cap funds must invest at least 80 per cent of their assets in large cap stocks. Midcap and small cap funds must invest at least 65 per cent of their assets in midcap (101st to 250th stocks by market capitalization) and small cap (251st and smaller stocks by market capitalization) stocks respectively
- Large cap funds are less volatile than midcap and small cap funds. Historically large cap stocks have seen lesser drawdowns (correction from market tops) in bear or highly volatile markets. The table below shows the 5 biggest drawdowns in the market over the last 10 years. You can see that large caps (represented by Nifty 100 TRI) had smaller drawdowns compared to midcaps (represented by Nifty Midcap 150 TRI) and small caps (represented by Nifty Small Cap 250 TRI)
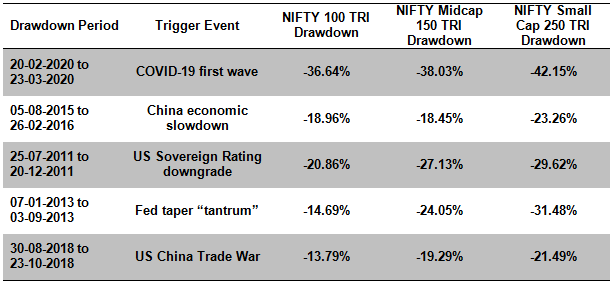
Source: National Stock Exchange, Advisorkhoj Research. Period: 01.06.2011 to 29.10.2021. Disclaimer: Past Performance may not be sustained in the future
- Midcap and small cap funds have the potential of outperforming large cap funds in different performance periods. Also, since midcap and small cap funds invest in a bigger universe of stocks which are not as well researched as large caps, potential of alpha creation is higher. However, large cap funds provide greater stability to your investment portfolio
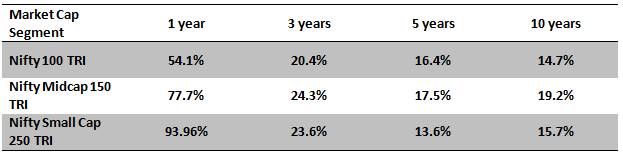
Source: National Stock Exchange, Advisorkhoj Research. Returns for periods exceeding 1 year are in CAGR. Period: 01.11.2011 to 29.10.2021. Disclaimer: Past Performance may not be sustained in the future
Wealth creation by large caps
The chart below shows the growth of Rs 10,000 investment in Nifty 100 TRI (index assumed for large cap stocks) over the last 10 years (ending 29th October 2021). You can see that the investment would have multiplied nearly 4 times (to Rs 39,289) in the last 10 years at a CAGR of 14.7 per cent.
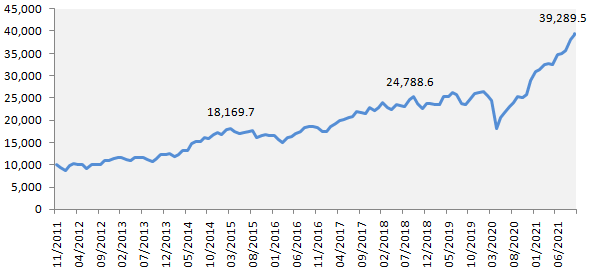
Source: National Stock Exchange, Advisorkhoj Research. Period: 01.11.2011 to 29.10.2021. Disclaimer: Past Performance may not be sustained in the future
What kind of companies are large cap?
The table below shows the top 10 industry sectors in the Nifty 100 index (index of all large cap stocks).
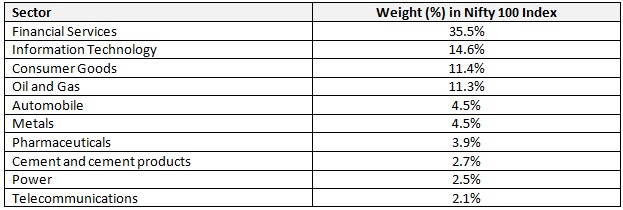
Source: National Stock Exchange, Nifty 100 Factsheet, as on 29th October 2021
Who should invest in large cap funds?
- Investors who are looking for capital appreciation over long investment tenures
- Investors who prefer relatively less volatility in their portfolio
- Large cap funds can be good investment options for new inexperienced investors who want exposure to equity
- Investors with moderately high to high risk appetites
- Investors with at least 5 years’ investment tenure
Why invest in large cap funds?
- Exposure to the largest companies and well-known brands
- Wealth creation in the long term with potential lesser downside risks
- Generally, provides High liquidity in volatile market conditions
- Ability to recover faster from deep corrections
- Relatively stable investment experience
Investors should consult with their financial advisors if large cap funds are suitable for their investment needs.
Understanding different kinds of mutual fund returns
Why do we invest in mutual funds? We want to get returns in the form of capital appreciation or income or both. Return on investment is a metric used to measure the performance of a mutual fund scheme. In this blog post, we will discuss about different type of returns and how you can use them to evaluate the performance of a scheme.
Absolute Return
Absolute return is the growth in your investment expressed in percentage terms. Suppose you invested Rs 1 lakh in a mutual fund scheme. A few years later, the value of your investment is Rs 1.5 lakhs. The total capital gain made by you is Rs 50,000. The absolute return in percentage terms is 50 per cent. A major weakness of absolute return as a performance measure is that return ignores the time over which the gain was achieved.
Compounded annual growth rate (CAGR)
Compounded annual growth rate or CAGR, in simplest term, is how much your investment grew in value on an annual basis. An important thing to note in CAGR is that the effect of compounding is included in CAGR. Compounding is profits earned on profits. If you invested Rs 1 Lakh in a mutual fund scheme and the value of your investment after 3 years is Rs 1.5 Lakhs, then the CAGR return will be 14.5 per cent. The formula of CAGR = (Final Value / Investment) ^(1/Investment tenure) -1. CAGR- is one of the most important return measures in mutual funds. Mutual fund returns for investment periods exceeding 1 year are always expressed in CAGR.
CAGR is the annual return you get on your investment with compounding effect i.e. at the end of each year you will earn return not only on your investment, but also on the accumulated profit like compound interest. In the above example, your mutual fund scheme earned a profit of Rs 0.5 lakhs on Rs 1 lakh investment i.e. absolute return of 50 per cent over 3 years. This means that, on an annualized basis, you earned return of 14.5 per cent. Your actual returns may have been different every year because mutual funds are market linked investments, but over your investment tenure you earned returns that are equivalent to annualized returns of 14.5 per cent.
Point to Point Return
Point to point return measures the return of a mutual fund scheme between two specific dates. If the period between the two dates i.e. start date and end date, exceeds 1 year then point to point return are expressed in CAGR. For example, you invested Rs 1 lakh in a mutual fund on 1st January 2018 and its value on 1st September 2021 was 1.5 lakhs. The period (in years) between 1st January 2018 and 1st September 2021 is 3.67 years. The point to point return over this, expressed in CAGR, was 11.7 per cent. The formula of point to point return is the same as CAGR. You can compare point to point returns of two mutual fund schemes in your portfolio, provided both are over sufficiently long investment tenures to see which may have performed better.
A variant of point to point return is known as trailing return. Trailing returns measure investment returns as on a specific date for various investment periods e.g. 6 months, 1 year, 3 years, 5 years etc. For example, if you want to calculate trailing returns of a scheme as on 31st August 2021, then start date for 1 year return will be 1st September 2020, start date for 3 year return will be 1st September 2018, start date for 5 year return will be 1st September 2016 etc. Mutual fund monthly factsheets present performance in terms of trailing returns (as on the last business day of the month).
XIRR
Point to point returns can be used to measure investment performance for investments, where there are two cash-flows i.e. one cash-inflow (investment) and one cash-outflow (redemption). However, point to point return cannot be used in instances where there are multiple investment date. e.g. SIPs or multiple redemption dates e.g. SWPs. There can be several other instances of multiple cash-flows e.g. dividend (IDCW) payouts, additional purchases, partial redemptions etc. The performance metric, XIRR is used in such cases.
XIRR is a variant of a financial term known as Internal Rate of Return (IRR). Without going into the mathematical complexities of IRR calculation, IRR measures the annualized return of a series of cash-flows (cash inflows and cash outflows). Investors can calculate XIRR using Microsoft Excel. Investors need to enter the transaction date and the cash-flows in the spreadsheet. Cash outflows (e.g. SIP instalments, additional purchases, one-time investment etc.) should be entered as negative values, while cash inflows (e.g. redemptions, dividend pay-outs, SWP payments etc.) should be entered as positive value. XIRR can be used to calculate returns of SIPs, SWPs or any other investment which has multiple cash inflows or outflows.
Rolling Returns
One of the criticisms of point to point return is that it is biased by the market conditions prevailing on the end date. For example, if the market is high on the end date of point to point return, then the return of the scheme will be high. However, the scheme may not have performed well in relative terms when the market was low. Rolling return solves this bias problem by calculating returns for a certain investment period e.g. 1 year, 3 year, 5 year etc., in different market conditions.
Rolling returns are the annualized returns of the scheme taken for a specified investment period e.g. 1 year, 3 years and 5 years etc. over a sufficiently long period across different market conditions. The returns may be rolled daily, monthly or yearly.
For example, let us assume that the performance period for rolling returns is last 10 years ending 31st August 2021. The period from 1st September 2011 to 31st August 2021 covers different market conditions e.g. bull markets, bear markets, flat markets etc. To calculate daily rolling returns, we will calculate returns for all 1 year investment periods (rolled daily) starting 1st September 2011, then 2nd September 2011, till we reach 31st August 2021. If we are calculating monthly rolling returns, then the investment periods will be rolled monthly i.e. 1st September 2011 to 31st August 2012, 1st October 2011 to 30st September 2012 etc. till we reach 31st August 2021. It is fairly intuitive that rolling returns will cover different types of market conditions.
Rolling returns of a scheme are usually compared with its market benchmark index. You can see how the scheme performed versus its benchmark index in different market conditions. Rolling returns will tell you if the fund manager of the scheme was able to beat the benchmark across different market conditions. Rolling return is a measure of consistency of the scheme’s performance.
Total Returns Index
Total return is actual return on investment which includes both price appreciation and dividends. Let us assume that the share price of a stock one year back was Rs 100. One year later, the share price is Rs 110. During the year, the stock also paid Rs 2 / share as dividend. Then the total return will be 12 per cent. A Total Return Index (e.g. Nifty 50 TRI) factors in both the appreciation of the parent index (Nifty 50) and the dividends paid by the constituents (underlying stocks) of the parent index. You should always compare the performance of your mutual fund scheme with the TRI returns of the benchmark index. As such, benchmark performance shown in scheme related documents like SID and monthly fund factsheets are TRI returns (as per SEBI’s requirements).
How to use different kinds of returns?
In this blog post, we have discussed different types of mutual fund returns. You should use these depending on your needs:
- To see how a scheme in your portfolio has performed, you can see its point to point return based on when you invested in the scheme
- For SIPs, SWPs, folios where you had multiple transactions e.g. additional purchase, partial redemptions etc., XIRR should be used
- For scheme selection for your portfolio, you can look at the trailing returns of the scheme versus the benchmark. For equity schemes however, you should also look at the rolling returns
- Finally, mutual fund returns on a standalone basis, is not very informative for performance evaluation because mutual funds are market linked instruments. You should always compare the relative performance of the scheme versus its benchmark index (TRI)
You should consult with your financial advisor if you need help in calculating returns of schemes in your mutual fund portfolio.
Should you invest in midcap mutual funds?
What are midcap stocks?
As per SEBI’s guidelines, 101st to 250th stocks by market capitalization are classified as midcap stocks. Market capitalization of a company is the share price of the company multiplied by the total number of shares outstanding.
Characteristics of midcap stocks
- Midcap stocks have more growth potential than large cap stocks (top 100 companies by market capitalization), at the same time Large cap stocks are relatively less volatile than midcaps
- Though midcap companies are smaller in terms of market capitalization than large caps, they also have well established business models with proven track records
- Midcap companies can be market leaders in industry sectors where large caps do not have any presence e.g. automobile ancillaries, specialty chemicals, textiles, media and entertainment etc
- Midcap stocks are relatively bigger in terms of assets, revenues and earnings compared to small cap stocks (251st and smaller companies by market capitalization). Hence they are relatively less volatile than small cap stocks
- Midcap stocks can be wealth creators over long investment horizon
What are midcap funds?
Midcap funds are equity mutual fund schemes which invest primarily in midcap stocks. As per SEBI’s mandate midcap mutual funds must invest at least 65 per cent of their assets in midcap stocks.
Performance of midcap index
The chart below shows the growth of Rs 10,000 lump sum investment in Nifty Midcap 150 TRI (Total Returns Index) versus Nifty 50 TRI (index of the 50 largest stocks by market capitalization) over the last 10 years ending 30th July 2021. You can see that Nifty Midcap 150 TRI was able to outperform Nifty 50 TRI over this period. The value of your investment in Nifty Midcap 150 TRI would have grown to Rs 48,000 as on 30th July 2021. The compounded annual growth rate (CAGR) of Nifty Midcap 150 TRI over the last 10 years was 16.98 per cent compared to Nifty 50 TRI return which is only 12.44 per cent for the same period.
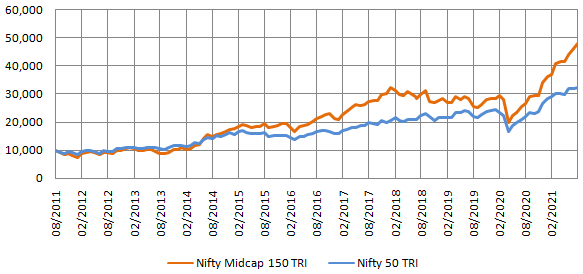
Source: National Stock Exchange, Advisorkhoj Research. Period: 01.08.2011 to 30.07.2021. Disclaimer: Past performance may or may not be sustained in the future.
SIP in Midcap Funds
Since midcap stocks are relatively volatile than large cap stocks, investors can take advantage by investing through Systematic Investment Plans (SIPs). In SIPs, you invest at regular intervals and typically at different prices (NAVs) and thereby get the benefit of Rupee Cost Averaging.
The chart below shows the growth of Rs 10,000 monthly SIP in Nifty Midcap 150 TRI over the last 10 years ending 30th July 2021. With a cumulative investment of Rs 12 lakhs you could have accumulated a corpus of Rs 34.16 lakhs over the last 10 years. The annualized SIP return (XIRR) over the last 10 years was 19.97 per cent.
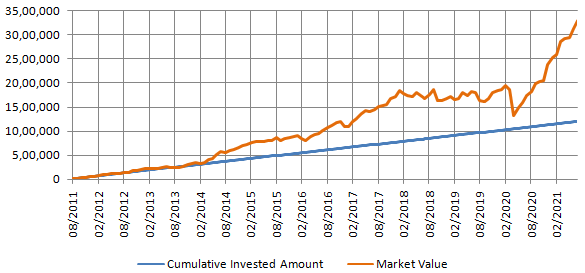
Source: National Stock Exchange, Advisorkhoj Research. Period: 01.08.2011 to 30.07.2021. Disclaimer: Past performance may or may not be sustained in the future.
Why invest in midcap funds?
- Investment in midcap funds can help you diversify your investment portfolio
- Mid cap stocks usually have lower percentage of institutional (foreign institutional investors and domestic institutional investors) ownership compared to large cap stocks. Hence these stocks tend to be less researched than large caps. Midcap stocks may not always reflect its intrinsic value. Fund managers can spot quality mid cap stocks which are trading at discounts to its intrinsic value considering their growth potential and over a long term can generate alpha for investors
- Mid Cap funds have the potential to outperform Large Cap funds to create wealth for investors over a long term investment horizons
- Investors can take advantage of relatively higher movement in midcap funds by investing through Systematic Investment Plans(SIP)
- Midcap funds tend to experience lesser drawdowns in deep corrections and bear markets compared to small cap funds
Longer investment tenures
You need to have longer investment tenures in midcaps for the following reasons:
- Midcap stocks are relatively volatile than large caps and experience larger drawdowns in volatile markets
- Historical data shows that bear market periods in midcaps tend to be longer compared to large caps
Who should invest in midcap funds?
- Investors who are looking for capital appreciation or wealth creation over long investment tenures
- Investors with high risk appetites
- Investors need to have long investment tenures. Financial advisors recommend 7 to 10 years or longer tenures for midcap funds
Investors should consult with their financial advisors if midcap funds are suitable for their investment needs.
a) What are mutual funds (MFs)?
A mutual fund is a well-established and regulated investment solution. Managed by professional fund managers, mutual funds are investment schemes that pool together capital from different investors and invest in various types of asset classes such as equities, bonds and money market instruments. The holdings could cover many more securities.
b) What are the broad groups of MFs?
Some of the broad groups that Mutual Funds can be classified into are as follows:
- Equity schemes: These schemes allow investors to participate in stock markets. They are ideal for investors in their prime earning stage, looking to build a portfolio that gives them superior returns over the long-term. Normally an equity fund or diversified equity fund as it is commonly called invests over a range of sectors to distribute the risk. Though categorized as high risk, these schemes also have a high return potential in the long run.
- Fixed income schemes: A fixed-income mutual fund focuses on investments that pay a set rate of return, such as government bonds, corporate bonds or other debt instruments. The idea is that the fund portfolio generates interest income which it then passes on to the shareholders. Sometimes referred to as bond funds or debt funds, these funds are usually actively managed.
- Balanced schemes: Balanced funds invest in a hybrid of asset classes, whether equity, debt, money market instruments, or alternative investments such as gold, etc. The objective is to reduce the risk of exposure across asset classes. This kind of fund is also known as an asset allocation fund. There are two variations of such funds designed to cater to the investors objectives. Some funds are defined with a specific allocation strategy that is fixed, so the investor can have a predictable exposure to various asset classes. Other funds follow a strategy for dynamic allocation percentages to meet various investor objectives. This may include responding to market conditions, business cycle changes, or the changing phases of the investor's own life. While the objectives are similar to those of a balanced fund, dynamic allocation funds offers freedom to a fund manager to switch the ratio of asset classes as needed to maintain the integrity of the fund's stated strategy.
- International funds: An international fund invests only in assets located outside your home country. These type of schemes as part of a well-balanced portfolio can reduce risk by increasing diversification, since the returns in foreign countries may be un-related with returns at your domestic country.
- Sector-based funds: These schemes concentrate on a certain segment of the economy or a targeted strategy. Sector funds are targeted towards a specific sector of the economy, such as financial, technology, health, infrastructure, etc. Sector funds can, therefore, be very volatile since the stocks in a given sector tend to be highly correlated with each other.
c) What does a fund manager do?
As the driver of the fund management strategy fund managers play a key role in any Asset Management Company. They primarily research and determine the best stocks, bonds, or other securities to fit the strategy of the fund as outlined in the scheme objectives and then buy and sell them. At larger fund houses, the fund manager typically has a support staff of analysts and traders who perform some of these activities on their behalf. There can even be multiple fund managers for a particular scheme that oversee the invested corpus and each may be responsible for their own portion such as stocks, bonds and more. Some other responsibilities of the fund manager include preparing reports on how well the fund is performing for clients and developing reports for potential clients to know the risks and objectives of the fund.
d) How easy or difficult is it to invest in MF?
It is very easy to invest in Mutual Funds in India, especially using all the digital tools available today, you can invest from the comforts of your home without ever stepping out.
e) Do I need a lot of money to invest in MFs?
Not at all. You can start investing in Mutual Funds via the SIP route for as low as Rs. 500. There are some mutual fund schemes that even allow investments of as low as Rs. 100. Do check the scheme information documents of a particular scheme for further details on this.
f) What is a Systematic Investment Plan (SIP)?
A Systematic Investment Plan popularly known as SIP, is a facility offered by mutual funds to the investors to invest in a disciplined manner. SIP allows an investor to invest a fixed sum of money at pre-defined intervals in a selected mutual fund scheme of the investor’s choice. The fixed amount of money can be as low as Rs. 500, while the SIP intervals can be on a weekly/monthly/quarterly/semi-annually or annual basis. By taking the SIP route to investments, the investor invests in a time-bound manner without worrying about market volatility and stands to benefit in the long-term due to cost averaging and the power of compounding.
g) What is the right time to start an SIP?
There is no right or wrong time to start an SIP. As mentioned in the answer above, an SIP helps the investor invest in a disciplined manner. And hence, an investor can start an SIP whenever he/she wants without worrying about timing the markets.
h) What is the minimum contribution to start an SIP?
It depends on the scheme in which an investor invests. Some schemes allow investments from Rs. 500 per month while some allow investing in them for as low as Rs. 100 a month. Please check the scheme information document of the scheme you wish to invest in for further details on this.
i) What role does a financial advisor play?
A financial advisor uses their knowledge and expertise to construct personalized financial plans that aim to achieve the financial goals of clients. They further check in with their clients on a regular basis to re-evaluate their current situation and future goals and plan accordingly. Many times, a Financial Advisor helps you invest in Mutual Funds through his own digital platform that he has created himself or via physical printed application forms as you deem fit.
Liked our content? Sign up to receive our educational content.
Issued as an investor education initiative.
Mutual Fund investments are subject to market risks, read all scheme related documents carefully.
© Copyright. HSBC Asset Management (India) Private Limited 2021, ALL RIGHTS RESERVED.
HSBC Asset Management (India) Private Limited, 9-11 Floors, NESCO IT Park, Building no. 3, Western Express Highway, Goregaon (East), Mumbai – 400 063, India.
Email: hsbcmf@camsonline.com | Website: www.assetmanagement.hsbc.co.in
Begin your journey here
Looking to dream big? Start your journey here.
Thank you for completing the Form
Your information has been savedYour details have been saved, and we will be in touch soon. Thank you for choosing us.
Apologies for the Inconvenience
An Error occured while saving your informationWe apologize for the inconvenience. Unfortunately, there was an error in saving your information. Please resubmit the form. Thank you for your understanding.